Absolute value graphs are a fundamental concept in mathematics, particularly in algebra and graphing. These graphs represent the absolute value function, which is defined as the distance of a number from zero on the number line, without considering direction. The absolute value function is denoted by |x| and is defined as |x| = x if x ≥ 0, and |x| = -x if x < 0. Understanding how absolute value graphs work is crucial for solving equations and inequalities, as well as for graphing more complex functions. In this article, we will explore 5 ways absolute value graphs work, including their definition, graphing, equations, inequalities, and real-world applications.
Key Points
- Absolute value graphs represent the absolute value function, which is defined as the distance of a number from zero on the number line.
- The graph of the absolute value function is a V-shaped graph that opens upwards, with its vertex at (0,0).
- Absolute value equations can be solved by considering two cases: one where the expression inside the absolute value is non-negative, and one where it is negative.
- Absolute value inequalities can be solved by using the properties of absolute value and considering the distance of a number from zero.
- Absolute value graphs have real-world applications in fields such as physics, engineering, and economics, where they are used to model distances, speeds, and costs.
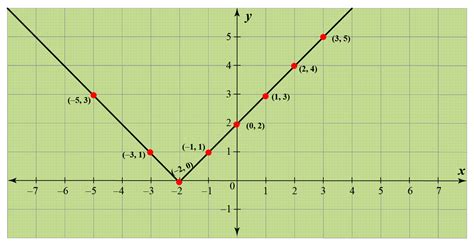
Definition and Graphing of Absolute Value Functions

The absolute value function is defined as |x| = x if x ≥ 0, and |x| = -x if x < 0. The graph of the absolute value function is a V-shaped graph that opens upwards, with its vertex at (0,0). The graph is symmetric about the y-axis, meaning that the graph to the left of the y-axis is a mirror image of the graph to the right. The absolute value function can be graphed by using a table of values or by using a graphing calculator.
Graphing Absolute Value Functions with Transformations
Absolute value functions can be transformed by shifting, stretching, or compressing the graph. For example, the graph of y = |x - 2| is a horizontal shift of the graph of y = |x| by 2 units to the right. The graph of y = 2|x| is a vertical stretch of the graph of y = |x| by a factor of 2. These transformations can be used to model real-world situations, such as the distance of an object from a fixed point.
| Transformation | Effect on Graph |
|---|---|
| Horizontal shift | Shifts graph left or right |
| Vertical stretch | Stretches graph upwards or downwards |
| Vertical compression | Compresses graph upwards or downwards |

Solving Absolute Value Equations

Absolute value equations can be solved by considering two cases: one where the expression inside the absolute value is non-negative, and one where it is negative. For example, the equation |x| = 3 can be solved by considering the cases x ≥ 0 and x < 0. If x ≥ 0, then |x| = x, so x = 3. If x < 0, then |x| = -x, so -x = 3, which gives x = -3. Therefore, the solutions to the equation are x = 3 and x = -3.
Solving Absolute Value Inequalities
Absolute value inequalities can be solved by using the properties of absolute value and considering the distance of a number from zero. For example, the inequality |x| < 3 can be solved by considering the cases x ≥ 0 and x < 0. If x ≥ 0, then |x| = x, so x < 3. If x < 0, then |x| = -x, so -x < 3, which gives x > -3. Therefore, the solution to the inequality is -3 < x < 3.
Real-World Applications of Absolute Value Graphs
Absolute value graphs have real-world applications in fields such as physics, engineering, and economics. For example, in physics, the absolute value function can be used to model the distance of an object from a fixed point, or the speed of an object. In engineering, the absolute value function can be used to model the stress on a material, or the distance of a structure from a fixed point. In economics, the absolute value function can be used to model the cost of producing a good, or the distance of a consumer from a fixed point.
Modeling Real-World Situations with Absolute Value Graphs
Absolute value graphs can be used to model a wide range of real-world situations, including distances, speeds, costs, and stresses. By using the properties of absolute value, these situations can be modeled and analyzed, allowing for predictions and decisions to be made. For example, a company may use absolute value graphs to model the cost of producing a good, and to determine the optimal production level. A physicist may use absolute value graphs to model the distance of an object from a fixed point, and to determine the object’s trajectory.
What is the definition of the absolute value function?
+The absolute value function is defined as |x| = x if x ≥ 0, and |x| = -x if x < 0.
How do you graph an absolute value function?
+The graph of the absolute value function is a V-shaped graph that opens upwards, with its vertex at (0,0). The graph can be graphed by using a table of values or by using a graphing calculator.
What are some real-world applications of absolute value graphs?
+Absolute value graphs have real-world applications in fields such as physics, engineering, and economics, where they are used to model distances, speeds, costs, and stresses.
In conclusion, absolute value graphs are a fundamental concept in mathematics, and have a wide range of applications in fields such as physics, engineering, and economics. By understanding how absolute value graphs work, and how to solve absolute value equations and inequalities, individuals can model and analyze a wide range of real-world situations, and make informed decisions. Whether you are a student, a professional, or simply someone interested in mathematics, absolute value graphs are an essential tool to have in your toolkit.


