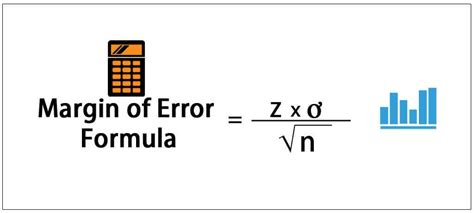
When dealing with statistical data, understanding the margin of error is crucial for making informed decisions. The margin of error, also known as the confidence interval, represents the amount of variation in the sample that can be expected when a population is sampled multiple times. Essentially, it measures how much the results from a sample may differ from the true population parameter. Calculating the margin of error can seem daunting, but with the right approach, it can be simplified.
Understanding the Basics of Margin of Error

The margin of error is typically denoted by the symbol E or ME and is expressed as a plus-or-minus value. For example, if a poll indicates that 60% of people prefer a certain product with a margin of error of ±3%, this means that the true percentage of people who prefer the product is likely between 57% and 63%. This range is known as the confidence interval. The margin of error is influenced by several factors, including the sample size, the confidence level desired, and the variability of the population.
Factors Influencing Margin of Error
Understanding the factors that affect the margin of error is key to calculating and interpreting it accurately. These factors include:
- Sample Size (n): The larger the sample size, the smaller the margin of error. This is because larger samples tend to provide more accurate representations of the population.
- Confidence Level: The confidence level is the probability that the true population parameter falls within the confidence interval. Common confidence levels are 90%, 95%, and 99%. A higher confidence level requires a larger sample size to achieve the same margin of error.
- Population Standard Deviation (σ): The variability or dispersion of the population also affects the margin of error. For populations with high variability, larger samples are needed to achieve the same level of precision.
Calculating the Margin of Error

The formula to calculate the margin of error (E) for a proportion is given by:
E = z * √(p*(1-p)/n), where:
- z: The Z-score corresponding to the desired confidence level. For a 95% confidence level, z = 1.96.
- p: The sample proportion. This is the proportion of the sample that has the characteristic of interest.
- n: The sample size.
For example, if a survey of 1,000 people found that 55% of them support a particular policy, and we want to calculate the margin of error for a 95% confidence level:
| Variable | Value |
|---|---|
| z | 1.96 (for 95% confidence level) |
| p | 0.55 (55% support the policy) |
| n | 1,000 (sample size) |

Plugging these values into the formula gives us the margin of error.
Interpreting the Margin of Error
Once calculated, the margin of error provides a range within which the true population parameter is likely to lie. It’s crucial to understand that the margin of error does not indicate the direction of the error (whether the sample overestimates or underestimates the population parameter) but rather the magnitude of the error. Therefore, when reporting findings, it’s essential to include the margin of error to provide a complete picture of the data’s reliability.
Key Points
- The margin of error is a measure of the amount of variation in the sample that can be expected when a population is sampled multiple times.
- It is influenced by the sample size, the desired confidence level, and the population's variability.
- A larger sample size generally leads to a smaller margin of error.
- The formula for calculating the margin of error for a proportion involves the Z-score, sample proportion, and sample size.
- Interpreting the margin of error requires understanding its implications for the reliability of the findings and the potential direction of the error.
In conclusion, understanding and calculating the margin of error is a fundamental aspect of statistical analysis. By grasping the factors that influence the margin of error and how to calculate it, researchers and analysts can better interpret their findings and make more informed decisions. Whether in the context of political polls, market research, or scientific studies, the margin of error plays a critical role in assessing the reliability and precision of the data.
What is the primary purpose of calculating the margin of error in statistical analysis?
+The primary purpose of calculating the margin of error is to determine the reliability of the sample statistics by estimating how much the sample results may differ from the true population parameters.
How does the sample size affect the margin of error?
+A larger sample size leads to a smaller margin of error, as it provides a more accurate representation of the population. This is because larger samples tend to have less variability.
What does the confidence level signify in the context of the margin of error?
+The confidence level indicates the probability that the true population parameter falls within the confidence interval. A higher confidence level (e.g., 99%) requires a larger sample size than a lower confidence level (e.g., 90%) to achieve the same margin of error.


