When it comes to understanding and analyzing data, there are several key concepts that play a crucial role in statistics and data science. Among these, the measures of central tendency, which include the mean, median, and mode, are fundamental in describing the central or typical values within a dataset. Each of these measures provides a unique perspective on the data, and they are used in various contexts depending on the nature of the data and the type of analysis being performed. In this article, we will delve into the concepts of mean, median, and mode, exploring their definitions, applications, and the scenarios in which one might be preferred over the others.
Understanding the Mean

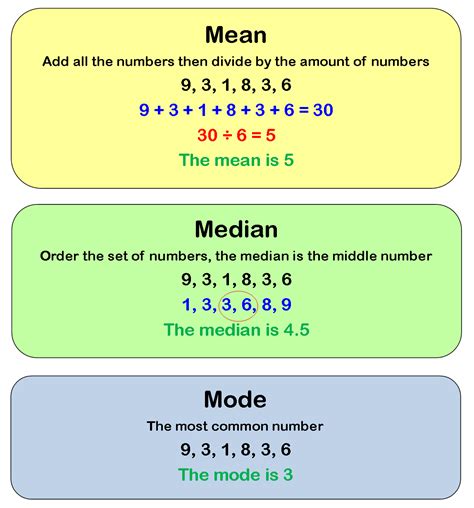
The mean, often referred to as the average, is calculated by summing up all the values in a dataset and then dividing by the number of values. It is a widely used measure of central tendency due to its simplicity and the fact that it takes into account every value in the dataset. However, the mean can be significantly affected by outliers, which are values that are far away from the other values in the dataset. For instance, in a set of exam scores where most students scored between 70 and 90, but one student scored 10, the mean would be pulled down by this outlier, potentially not accurately representing the central tendency of the dataset.
Application of the Mean
The mean is particularly useful in datasets where the values are spread out in a somewhat consistent manner and where there are no extreme outliers. It is commonly used in financial analyses, such as calculating the average return on investment, and in scientific research to describe the average outcome of an experiment. For example, if a researcher is studying the effect of a new drug on blood pressure, the mean reduction in blood pressure across all participants might be a key metric of interest.
| Measure | Calculation | Description |
|---|---|---|
| Mean | Sum of all values / Number of values | Average value of the dataset |
| Median | Middle value when data is ordered | Middle value in an ordered list of numbers |
| Mode | Most frequently occurring value | Value that appears most often in the dataset |

Exploring the Median

The median is the middle value in a dataset when it is ordered from smallest to largest. If the dataset has an even number of values, the median is the average of the two middle values. The median is less affected by outliers compared to the mean, making it a more robust measure of central tendency in datasets with extreme values. For instance, in the case of the exam scores mentioned earlier, the median would provide a better representation of the typical score because it would not be skewed by the student who scored 10.
Application of the Median
The median is particularly useful in datasets with outliers or in skewed distributions. It is commonly used in real estate to describe the median house price in an area, as it gives a better indication of the typical house price than the mean, which could be skewed by very expensive or very cheap properties. Additionally, in medical studies, the median survival time is often used to describe the outcome of treatments because it is less affected by extreme cases.
Key Points
- The mean is the average of all values in a dataset and is sensitive to outliers.
- The median is the middle value in an ordered dataset and is less affected by outliers.
- The mode is the most frequently occurring value in a dataset.
- Choice of measure of central tendency depends on the nature of the data and the analysis being performed.
- Understanding the differences between mean, median, and mode is crucial for accurate data interpretation.
Understanding the Mode
The mode is the value that appears most frequently in a dataset. A dataset may have one mode (unimodal), more than one mode (bimodal or multimodal), or no mode at all if all values are unique. The mode is useful for describing categorical data or data that is not numerical in nature. For example, in a survey of favorite colors, the mode would be the color that is chosen most often.
Application of the Mode
The mode is particularly useful in market research and social sciences to understand preferences or common characteristics within a population. It can also be used in quality control to identify the most common defect in a manufacturing process. However, the mode can be less informative for datasets with many unique values or when the distribution of data is continuous, as there might not be a clear most frequent value.
What is the main difference between the mean and the median?
+The main difference between the mean and the median is how they are affected by outliers. The mean is the average of all numbers in a dataset and can be significantly skewed by extreme values, whereas the median is the middle value and is less affected by outliers.
When would you use the mode as a measure of central tendency?
+The mode is used as a measure of central tendency when you are dealing with categorical data or when the most common value is of interest. It's particularly useful in surveys, market research, and quality control.
How do you choose between the mean, median, and mode for data analysis?
+The choice between the mean, median, and mode depends on the nature of your data and what you want to understand. If your data is continuous and has no outliers, the mean might be appropriate. If your data has outliers, the median could provide a better representation of the central tendency. For categorical data or when looking for the most common value, the mode is more suitable.
In conclusion, the mean, median, and mode are essential measures of central tendency, each with its own strengths and weaknesses. Understanding when to use each measure is crucial for accurate and meaningful data analysis. By considering the nature of the data, the presence of outliers, and the goals of the analysis, researchers and analysts can choose the most appropriate measure of central tendency to describe their data effectively.