To calculate the Chi Square p-value, we must first understand what the Chi Square test is and its application in statistical analysis. The Chi Square test is a statistical method used to determine whether there is a significant association between two categorical variables. It is commonly used in hypothesis testing to evaluate the likelihood that any observed difference between the variables and the expected outcome could have occurred by chance.
Understanding Chi Square Test

The Chi Square test statistic is calculated using the formula: χ² = Σ [(observed frequency - expected frequency)^2 / expected frequency], where the observed frequency is the actual number of observations in each category, and the expected frequency is the number of observations expected in each category under the null hypothesis. The degrees of freedom for the Chi Square test, when comparing two categorical variables, are calculated as (number of rows - 1) * (number of columns - 1).
Calculating Chi Square Statistic
For example, consider a study examining the relationship between smoking status (smoker or non-smoker) and the development of lung cancer (present or absent). The data could be presented in a 2x2 contingency table as follows:
| Smoking Status | Lung Cancer Present | Lung Cancer Absent | Total |
|---|---|---|---|
| Smoker | 20 | 80 | 100 |
| Non-Smoker | 5 | 95 | 100 |
| Total | 25 | 175 | 200 |

Using the Chi Square formula, we calculate the expected frequencies under the null hypothesis and then the Chi Square statistic. The degrees of freedom in this case would be (2-1)*(2-1) = 1.
Interpreting Chi Square Statistic
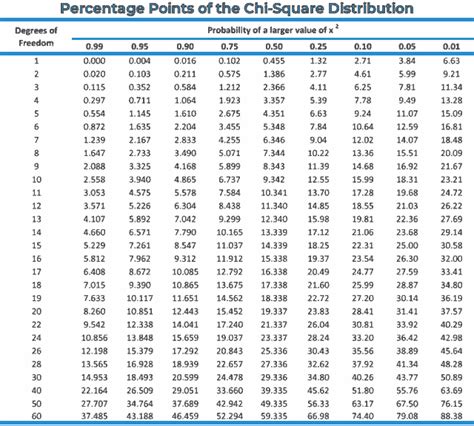
Once the Chi Square statistic is calculated, we can look up its corresponding p-value in a Chi Square distribution table, using the calculated degrees of freedom. Alternatively, statistical software or calculators can be used to directly compute the p-value.
Chi Square P-Value Calculation Example

Let’s assume the calculated Chi Square statistic from our example is 10.25, with 1 degree of freedom. Using a Chi Square distribution table or calculator, we find the p-value corresponding to this statistic. Suppose the p-value is 0.0012, which is less than 0.05. This indicates that we reject the null hypothesis, concluding that there is a statistically significant association between smoking status and the development of lung cancer.
Practical Application of Chi Square Test
In practice, the Chi Square test is widely used in various fields, including medicine, social sciences, and marketing, to assess relationships between categorical variables. For instance, it could be used to evaluate the effectiveness of a new drug by comparing the outcomes (e.g., cured or not cured) among different patient groups (e.g., those receiving the new drug versus those receiving a placebo).
Key Points
- The Chi Square test is used to determine if there is a significant association between two categorical variables.
- The test statistic is calculated based on the difference between observed and expected frequencies.
- The degrees of freedom depend on the number of categories in each variable.
- The p-value is used to decide whether to reject the null hypothesis, indicating a significant association.
- A p-value less than the chosen significance level (often 0.05) leads to rejection of the null hypothesis.
In conclusion, the Chi Square test is a powerful tool for analyzing categorical data and determining the significance of associations between variables. Understanding how to calculate and interpret the Chi Square statistic and its corresponding p-value is essential for making informed decisions in research and practical applications.
What is the purpose of the Chi Square test?
+The Chi Square test is used to determine if there is a significant association between two categorical variables.
How is the Chi Square statistic calculated?
+The Chi Square statistic is calculated using the formula: χ² = Σ [(observed frequency - expected frequency)^2 / expected frequency].
What does the p-value indicate in the context of the Chi Square test?
+The p-value represents the probability of observing the results of the study, or more extreme, if the null hypothesis is true. A p-value below the chosen significance level indicates a statistically significant association.